![]() Figure 1 of
Kumar, Mol Vis 2004;
10:445-449.
Figure 1 of
Kumar, Mol Vis 2004;
10:445-449.
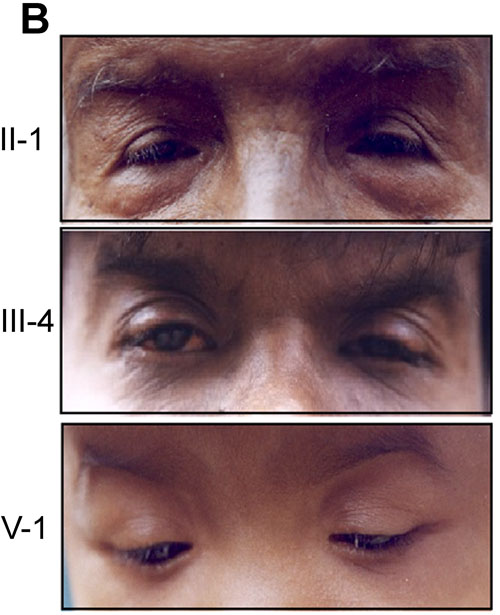
Figure 1. Haplotype and partial facial photographs of affected individuals
A: Haplotype analysis of family IIS-100 with microsatellite markers from the FOXL2 candidate region. The disease haplotype 2-2-4-3-3-3 is boxed. B: Partial facial photographs of affected individuals II-1, III-4, and V-1.