![]() Figure 2 of
Bennett, Mol Vis 2004;
10:376-382.
Figure 2 of
Bennett, Mol Vis 2004;
10:376-382.
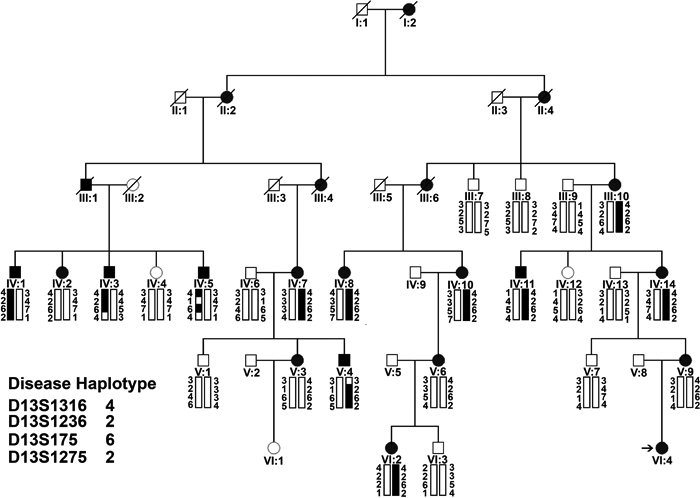
Figure 2. Cataract pedigree and haplotype analysis
Pedigree and haplotype analysis of the cataract family showing segregation of four microsatellite markers on chromosome 13q, listed in descending order from the centromere. Squares and circles symbolize males and females, respectively. Filled symbols denote affected status.
