![]() Figure 7 of
Ottino, Mol Vis 2004;
10:341-350.
Figure 7 of
Ottino, Mol Vis 2004;
10:341-350.
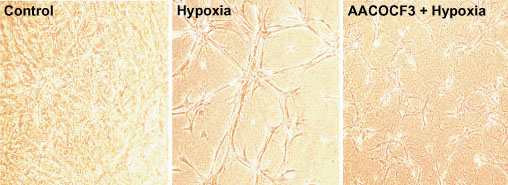
Figure 7. Phase-contrast micrographs of RF/6A cell growth in a three dimensional gel
Cells were exposed to 4 h of hypoxia then to 72 h of normoxia. The left panel represents the normoxic control with no exposure to hypoxia, where only small cellular aggregates and short tube-like structures were apparent. The hypoxic condition (middle panel) reflects the typical situation of larger cellular aggregates and branches of intensive tube formation. The AACOCF3 treated hypoxic condition shown in the right panel demonstrates a reduction in the number of tubes formed. Phase-contrast photomicrograph at 100x magnification; scale bar represents 200 μm.