![]() Figure 6 of
Ottino, Mol Vis 2004;
10:341-350.
Figure 6 of
Ottino, Mol Vis 2004;
10:341-350.
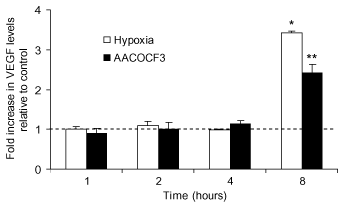
Figure 6. Time-dependent effect of hypoxia on VEGF protein levels in medium from RF/6A cells as measured by ELISA.
Values represent fold increases in VEGF levels relative to untreated controls (dotted line). Pretreatment with AACOCF3, significantly reduced VEGF levels at 8 h of hypoxia. Controls were treated with the vehicle alone (0.01% ethanol). The values on the graph represent the mean of four experiments (error bars represent the SEM). A single asterisk ("*") indicates a significant difference (p<0.001) with respect to vehicle controls; double asterisks ("**") indicate a significant difference (p<0.05) relative to hypoxia treated group at 8 h.
