![]() Figure 5 of
Ottino, Mol Vis 2004;
10:341-350.
Figure 5 of
Ottino, Mol Vis 2004;
10:341-350.
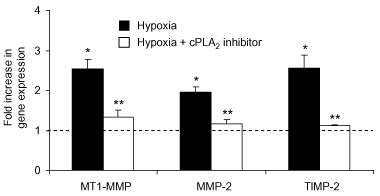
Figure 5. The phospholipase A2 inhibitor AACOCF3 decreases hypoxia-induced MMP mRNA abundance
Cells were incubated 2 h in normoxic or hypoxic conditions in the presence of 10 μM AACOCF3. Total RNA was isolated and real-time PCR was performed as explained in Methods. The values on the graph represent fold increases in MMP and TIMP-2 levels relative to normoxic controls (dotted line). A single asterisk ("*") indicates a significant (p<0.01) difference relative to normoxic controls. Double asterisks ("**") indicate a significant difference (p<0.01) relative to hypoxia treated samples.
