![]() Figure 1 of
Ottino, Mol Vis 2004;
10:341-350.
Figure 1 of
Ottino, Mol Vis 2004;
10:341-350.
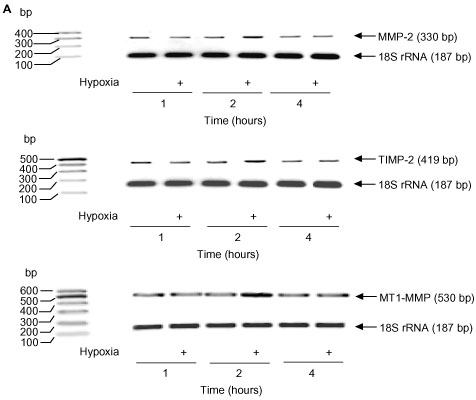
Figure 1. Time-dependent effect of hypoxia on MMP-2, TIMP-2, and MT1-MMP mRNA expression in choroidal EC
A: The MT1-MMP, detected by RT-PCR, revealed a 530 bp product, while MMP-2 and TIMP-2 produced amplification products of 330 bp and 419 bp, respectively. The expression of the housekeeping gene 18S rRNA did not change under the conditions tested in these experiments. In each gel, negative controls without reverse transcriptase (RT-minus) and without RNA (RNA-minus) were run (not shown). These gels are representative of two separate experiments. B: Analysis of MMP-2, TIMP-2, and MT1-MMP gene expression by real-time PCR. Values on the graph represent fold increases in gene expression above normoxic controls (dotted line) and are the mean of three independent experiments (each experiment run in triplicate; error bars represent the SEM). An asterisk ("*") indicates a significant difference relative to the normoxic control. p<0.01 for MMP-2; p<0.02 for MT1-MMP; p<0.05 for TIMP-2.