![]() Figure 7 of
Koizumi, Mol Vis 2004;
10:328-340.
Figure 7 of
Koizumi, Mol Vis 2004;
10:328-340.
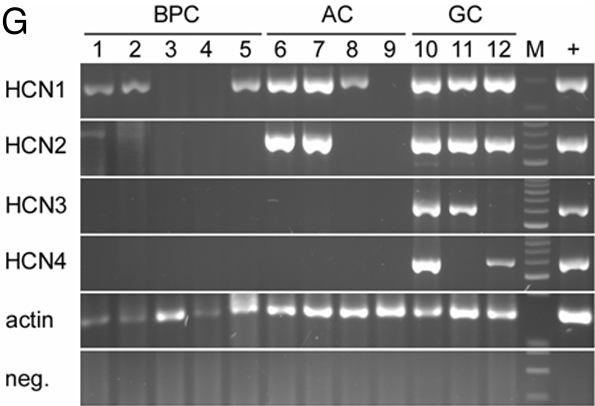
Figure 7. RT-PCR for HCN channels
HCN1 and/or HCN2 contribute to IIR in amacrine cells. A-F: Voltage-clamp recordings of IIR. Currents in control condition (A and D) and during external Cs+ (5 mM) application (B and E). Voltage pulses from -111 mV to -71 mV, in 10 mV steps, for 200 msec. C: Single cell RT-PCR of the cell with IIR in A-C showed HCN1- and HCN2-positive bands. F: Single-cell RT-PCR of the cell with IIR in D-F showed only HCN2-positive band. G: Single-cell RT-PCR of isolated retinal neurons. HCN1-4 and actin mRNAs were coamplified from freshly dissociated single retinal cells. Lanes 1,2: rod bipolar cells; note the faint bands in the HCN2 panel. Lanes 3-5: cone bipolar cells. Lanes 6+7: CD15+ amacrine cells. Lanes 8,9: amacrine cells negative for CD15. Lanes 10-12: ganglion cells; M, molecular weight marker; +, positive control from whole-retina RNA. The lowest panel shows the matched negative control for every cell, tested for actin.