![]() Figure 4 of
Cullinan, Mol Vis 2004;
10:315-322.
Figure 4 of
Cullinan, Mol Vis 2004;
10:315-322.
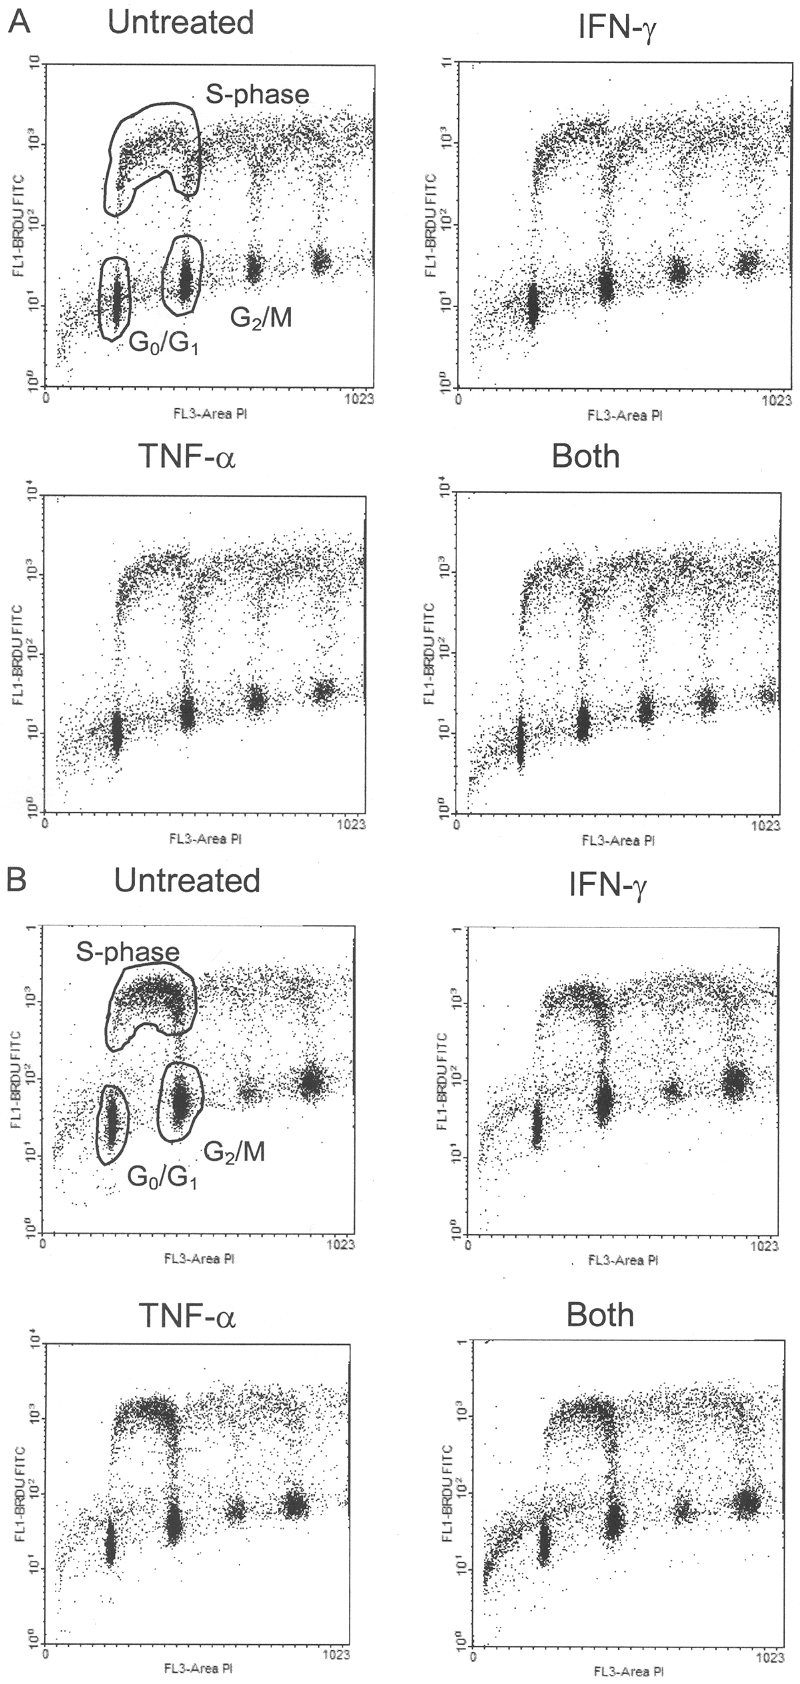
Figure 4. Analysis of the cell cycle in cytokine treated Y79 and Weri Rb-1 cells
A total of 3x10⁶ cells were incubated for 72 h with either 50 ng/ml of recombinant human IFN-γ, TNF-α, or both cytokines (50 ng/ml each) in the presence of 10% FBS. The cells were then pulsed with BrdU for 1 h before analysis by FACS. The gates for the G0/G1, S, and G2/M phases are shown in the untreated panels for each cell line. Table 1 summarizes the percentages of the cells in each phase of the cell cycle. Due to the aneuploidy of the cells, we chose to gate only in the region between 200-400 on the X-axis, thus the percentages do not total to 100. In all samples, the gated area totaled greater than 70%, so the majority of the cells were included in the analysis. A: Y79 cells; B: Weri Rb-1 cells.
