![]() Figure 3 of
Lambert, Mol Vis 2004;
10:289-296.
Figure 3 of
Lambert, Mol Vis 2004;
10:289-296.
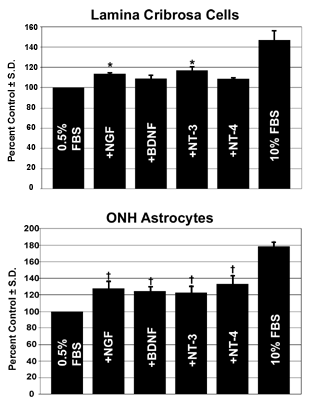
Figure 3. Cell number following exogenous NT treatment
Adult cell lines were treated with exogenous NT (50 ng/ml) in 0.5% FBS media for 7 days. Data are reported as a percent of the control; error bars represent the standard deviation based on three separate experiments. Three LC cell lines and three ONH astrocyte cell lines were assayed per experiment. Statistically significant differences (Student's t-test) between NT treatment and controls are marked with plus signs (+, p<0.01) and asterisks (*, p<0.005).