![]() Figure 3 of
Loewen, Mol Vis 2004;
10:272-280.
Figure 3 of
Loewen, Mol Vis 2004;
10:272-280.
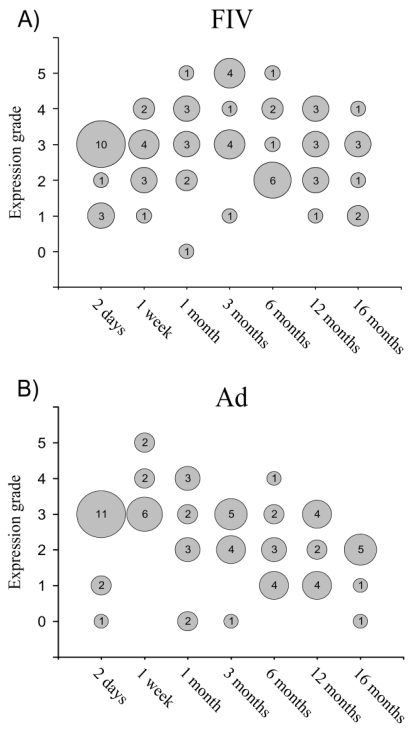
Figure 3. Time course of β-galactosidase expression for FIV and Ad vectors
Time course of β-galactosidase expression. FIV is shown in A; Ad vectors are shown in B. Circle sizes represent the number of animals at each grade. FIV expression reached a maximum extent at 3 months and then decreased, while expression from Ad vectors reached its maximum extent at 1 week.
