![]() Figure 1 of
Sabah, Mol Vis 2004;
10:254-259.
Figure 1 of
Sabah, Mol Vis 2004;
10:254-259.
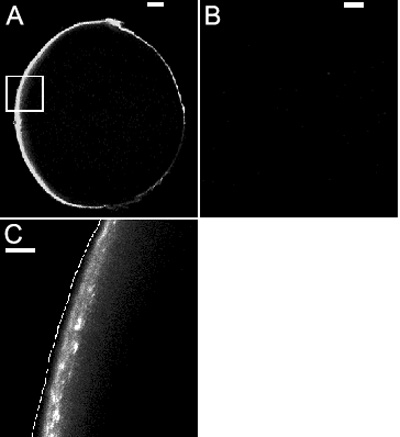
Figure 1. Alexa-albumin passage into the lens
Confocal scanning microscopy of rat lens after in vivo injection of Alexa-albumin into the aqueous chamber of the eye. Images were aligned with anterior side (left) and posterior side (right). Confocal scanning microscopy was used to visualize fluorescence of Alexa-albumin. A: Midsagittal section of lens at 5 min postinjection of Alexa-albumin in PBS. B: Midsagittal section of lens at 5 min postinjection of PBS alone. C: Higher magnification of boxed region in A. Dotted line in C represents the outer surface of the lens capsule, as determined by differential interference contrast imaging. The white bars represent 300 μm for A and B and 60 μm for C.