![]() Figure 2 of
McKay, Mol Vis 2004;
10:240-247.
Figure 2 of
McKay, Mol Vis 2004;
10:240-247.
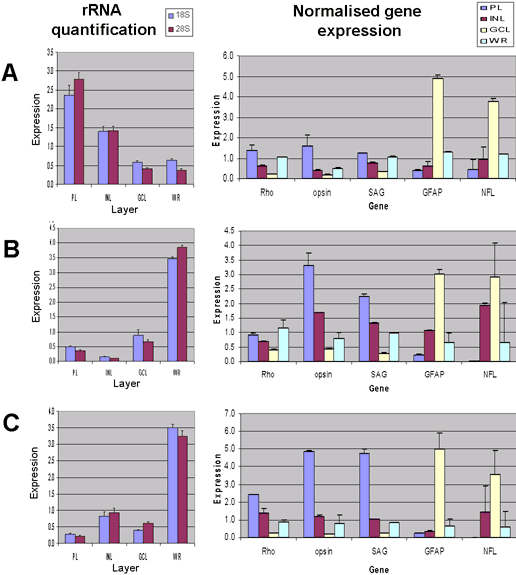
Figure 2. Quantification of mRNA from enriched retinal cell populations
mRNA levels from retinal preparations enriched for specific cell populations were quantified relative to rRNA. The left hand graphs indicate the relative expression of 18S and 28S rRNAs as determined by quantitative RT-PCR. The samples are the cryosection preparations enriched for the photoreceptor layer (PRL), inner nuclear layer (INL) or ganglion cell layer (GCL) and whole retina (WR). The right hand graphs show the relative expression values determined for rhodopsin, cone opsin, glial fibrillary acidic protein, S-antigen and neurofilament. The results from three independent retinas are shown and in each case the cell type specific gene expression levels are normalized according to the cognate rRNA levels indicated in the adjacent graph.