![]() Figure 3 of
Pfeffer, Mol Vis 2004;
10:23-30.
Figure 3 of
Pfeffer, Mol Vis 2004;
10:23-30.
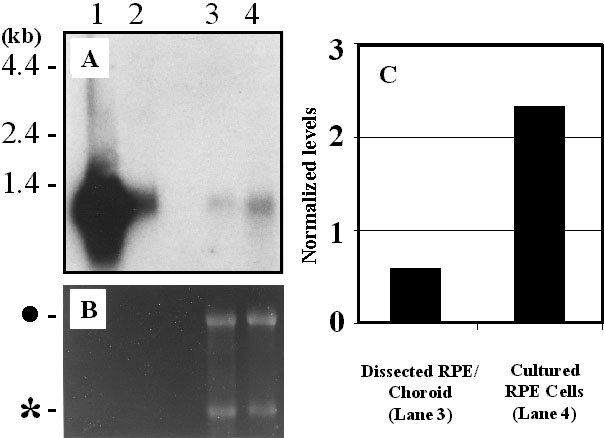
Figure 3. Northern analysis for retinol binding protein in monkey tissues
A: 18-day autoradiographic exposures are displayed in the upper part of lanes 1-4. For lanes 1 and 2, 1 μg poly(A+) mRNA from monkey liver and brain, respectively, were loaded. For lanes 3 and 4, 3 μg of total RNA from freshly dissected monkey RPE/choroid complex and from cultured monkey RPE cells, respectively, were loaded. For monkey liver, a single dense band centered around ca. 1100 bp is evident (lane 1). Monkey brain also expresses one 1100 bp transcript (lane 2). Both monkey RPE/choroid (lane 3) and cultured RPE (lane 4) exhibit 1100 bp bands. B: The RNA electrophoresed on the agarose gel was stained with ethidium bromide and visualized with ultraviolet illumination before transfer to nylon membrane. The lower part of lanes 1-4 corresponds to the samples described in A, above. The density of the 28s (denoted by black dot) and 18s (asterisk) ribosomal RNA bands for fresh RPE/choroid (lane 3) and cultured RPE (lane 4) are a function of the relative loading with total RNA. C: Densitometric analysis of the 1100 bp bands from lanes 3 and 4 of the northern blot in A, above, using the 18 s ethidium bromide stained band in lane 4 of B, above, for normalization. The RBP mRNA in cultured RPE is 3.9 times as abundant as that for freshly harvested RPE/choroid.