![]() Figure 2 of
Pfeffer, Mol Vis 2004;
10:23-30.
Figure 2 of
Pfeffer, Mol Vis 2004;
10:23-30.
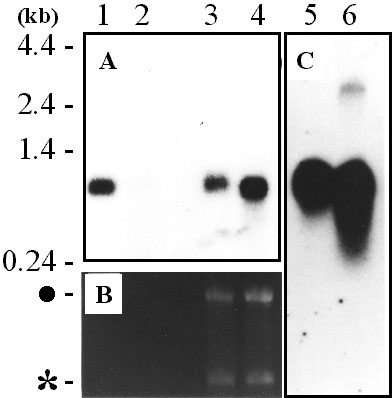
Figure 2. Northern analysis for transthyretin in monkey tissues
A: Two hour autoradiographic exposures are displayed in the upper part of lanes 1-4. For lanes 1 and 2, 1 μg poly(A+) mRNA from monkey liver and brain, respectively, were loaded. For lanes 3 and 4, 3 μg of total RNA from freshly dissected monkey RPE/choroid complex and from cultured monkey RPE (retinal pigmented epithelium) cells, respectively, were loaded. Monkey liver expresses one major transcript at ca. 900 bp (lane 1). No signal is evident from the monkey brain sample at this short exposure time (lane 2). One 900 bp transcript is seen from the fresh monkey RPE/choroid sample (lane 3), while for cultured monkey RPE, the single 900 bp transcript band in lane 4 is denser than that for native RPE/choroid. B: The RNA electrophoresed on the agarose gel was stained with ethidium bromide and visualized with ultraviolet illumination before transfer to nylon membrane. The lower part of lanes 1-4 corresponds to the samples described in A, above. The density of the 28 s (denoted by black dot) and 18 s (asterisk) ribosomal RNA bands for fresh RPE/choroid (lane 3) and cultured RPE (lane 4) are a function of the relative loading with total RNA. C: Four day autoradiographic exposures for total RNA from monkey RPE/choroid and cultured RPE are displayed in lanes 5 and 6, respectively. No additional bands are evident in the native tissue sample, while overexposure elicits a faint, larger mRNA species, ca. 3 kbp for cultured RPE. Molecular size scale in kilobase pairs (kb). D: Densitometric analysis of the 900 bp bands from lanes 3 and 4 of the northern blot in A, above, using the 18 s ethidium bromide stained band in lane 4 of B, for normalization. By this measurement, the TTR mRNA in cultured RPE is 1.4 times as abundant as that for freshly harvested RPE/choroid.