![]() Figure 7 of
Martin, Mol Vis 2004;
10:199-207.
Figure 7 of
Martin, Mol Vis 2004;
10:199-207.
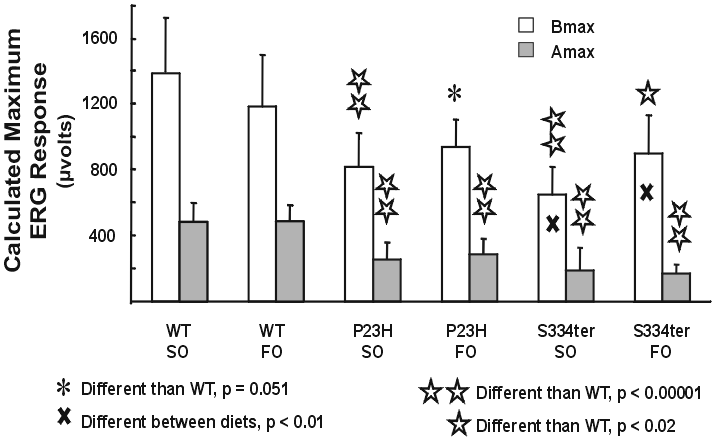
Figure 7. Maximum electroretinogram responses in wild type and mutant rats
Wild type (WT), P23H, and S344ter rats were fed safflower oil (SO, n-6 fatty acid-rich) or flaxseed oil (FO, n-3 fatty acid-rich) from the fifteenth day of gestation and electroretinograms (ERGs) measured at 55 days of age. The graph shows the mean values of the Bmax (maximal b-wave amplitude) and Amax (maximal a-wave amplitude) derived from the electroretinographic sensitivity curves; the standard deviation is represented by the error bars. Statistical differences relative to WT (Scheffé tests) are indicated (n=4 to 7).
