![]() Figure 2 of
Martin, Mol Vis 2004;
10:199-207.
Figure 2 of
Martin, Mol Vis 2004;
10:199-207.
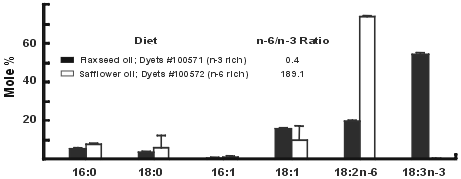
Figure 2. Fatty acid content of diets
Diets contained fatty acids derived exclusively of either safflower oil or flaxseed oil (10%, g/g). The fatty acid composition of each oil is reported as mole% of total fatty acids. The graph shows the mean values; the standard deviation is represented by the error bars (n=3).
