![]() Figure 2 of
Rundle, Mol Vis 2004;
10:177-185.
Figure 2 of
Rundle, Mol Vis 2004;
10:177-185.
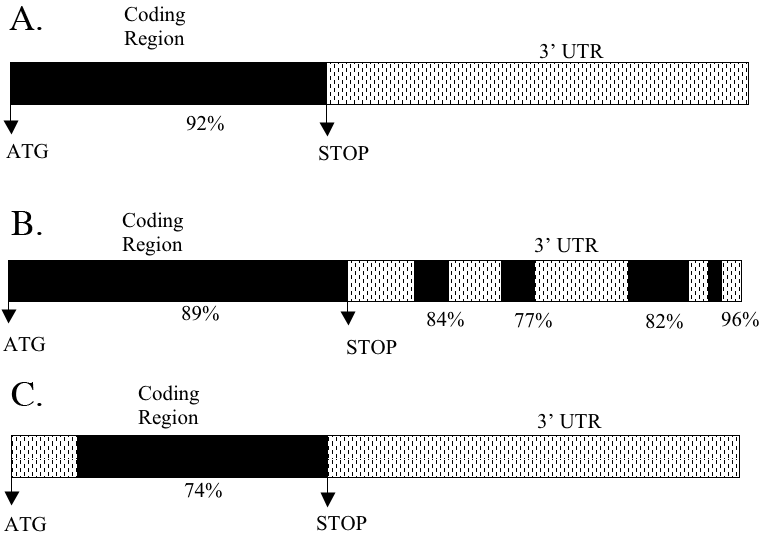
Figure 2. Nucleotide homology of NMT isoforms
Homology was determined by BLAST alignment. A: Bovine retina Type I NMT (bNMTS I) comparison to human liver Type I NMT (hNMTS I). B: Bovine retina Type II NMT (bNMT II retina) comparison to human liver Type II NMT (hNMT II liver). C: Bovine retina Type II NMT (bNMT II retina) comparison to human liver Type I NMT (bNMT I retina). Black blocks indicate regions of high homology and the number represents percent homology, hatched blocks indicate regions of no significant homology.
