![]() Figure 3 of
Mackay, Mol Vis 2004;
10:155-162.
Figure 3 of
Mackay, Mol Vis 2004;
10:155-162.
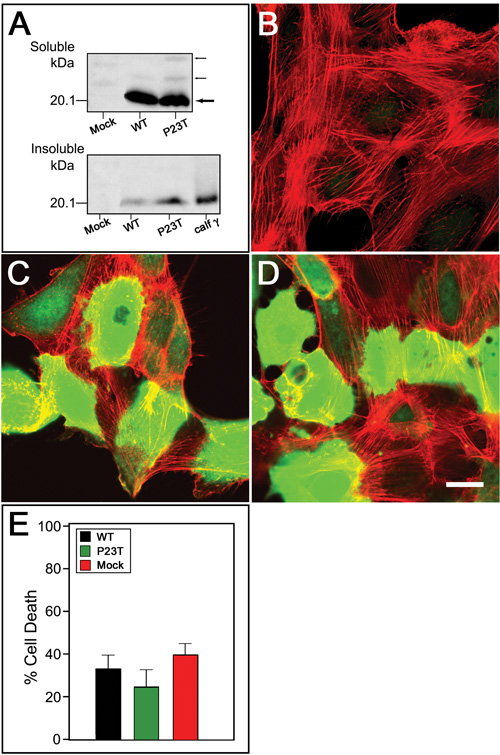
Figure 3. Expression analysis of CRYGD in HLE-B3 cells
A: Immunoblot analysis of detergent-soluble and insoluble fractions from vector only (Mock), wild type (WT), and mutant (P23T) transfectants, showing absence of CRYGD antigen (Mr 20.74 kDa) in Mock transfectants, equivalent levels of soluble CRYGD in WT and P23T transfectants (large arrow), and increased levels of insoluble CRYGD in P23T versus WT transfectants. Small arrows indicate weak immunoreactivity of the calf γ-crystallin antiserum with unidentified soluble proteins. B,C,D: Immunofluorescence confocal microscopy of vector only (B), wild type (C) and mutant (D) transfectants showing intense immunostaining (green) of CRYGD, primarily localized to the cytoplasm in C and D, and absence of significant immunostaining in B. Texas Red-phalloidin staining of the f-actin cytoskeleton is shown in red. The bar represents 20 μm. E: FACS analysis showing relative percentages of apoptotic cells in wild type (WT), mutant (P23T), and mock (vector only) transfectants.