![]() Figure 5 of
Yao, Mol Vis 2004;
10:138-143.
Figure 5 of
Yao, Mol Vis 2004;
10:138-143.
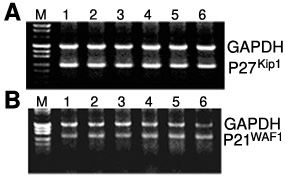
Figure 5. The levels of mRNA for P21WAF1 and P27Kip1 were examined by RT-PCR
Lane M is the DNA molecular size marker. Lane 1 is sham treated cells for 4 h, lane 2 is sham treated cells for 6 h, lane 3 is sham treated cells for 8 h, lane 4 is cells treated with microwave for 4 h, lane 5 is cells treated with microwave for 6 h, and lane 6 is cells treated with microwave for 8 h. Expression of GAPDH mRNA was used as the internal standard. A: Levels of P27Kip1 mRNA. B: Levels of P21WAF1 mRNA. C: Quantitative analysis of mRNA by densitometric scanning (n=4). The error bars represent the standard deviation. Each displayed value was normalized against the density of the respective band of GAPDH. There were no significant differences in P27Kip1 and P21WAF1 mRNA levels between microwave treatment and control groups (p>0.05).