![]() Figure 4 of
Yao, Mol Vis 2004;
10:138-143.
Figure 4 of
Yao, Mol Vis 2004;
10:138-143.
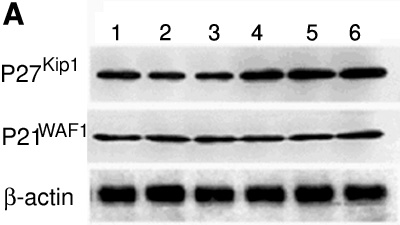
Figure 4. P21WAF1 and P27Kip1 protein levels examined by western blot analysis
A: Expression of P21WAF1 and P27Kip1 were assessed by western blot analysis. Lane 1 is sham treated cells for 4 h, lane 2 is sham treated cells for 6 h, lane 3 is sham treated cells for 8 h, lane 4 is cells treated with microwave for 4 h, lane 5 is cells treated with microwave for 6 h, and lane 6 is cells treated with microwave for 8 h. β-Actin was used as the loading control. B: Quantitative analysis of proteins by densitometric scanning of immunoblots (n=5). The error bars represent the standard deviation. All representations were as in A. Each displayed value was normalized against the density of the respective band of β-actin. There were statistically significant differences in P27Kip1 levels between the microwave groups and sham treatment groups ("*" indicates p<0.01 for comparison with sham treated cells).