![]() Figure 2 of
Yao, Mol Vis 2004;
10:138-143.
Figure 2 of
Yao, Mol Vis 2004;
10:138-143.
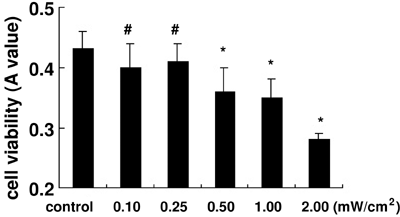
Figure 2. MTT analysis of cell viability after microwave treatment
A small decrease of cell viability could be seen after treatment for 8 h with 0.50 and 1.00 mW/cm2 microwave radiation and was more prominent after treatment with 2.00 mW/cm2 microwave radiation. The error bars represent the standard deviation. Results of statistical comparisons to the control group are denoted by a sharp (p>0.05) or asterisk (p<0.01).
