![]() Figure 2 of
Ebong, Mol Vis 2004;
10:122-131.
Figure 2 of
Ebong, Mol Vis 2004;
10:122-131.
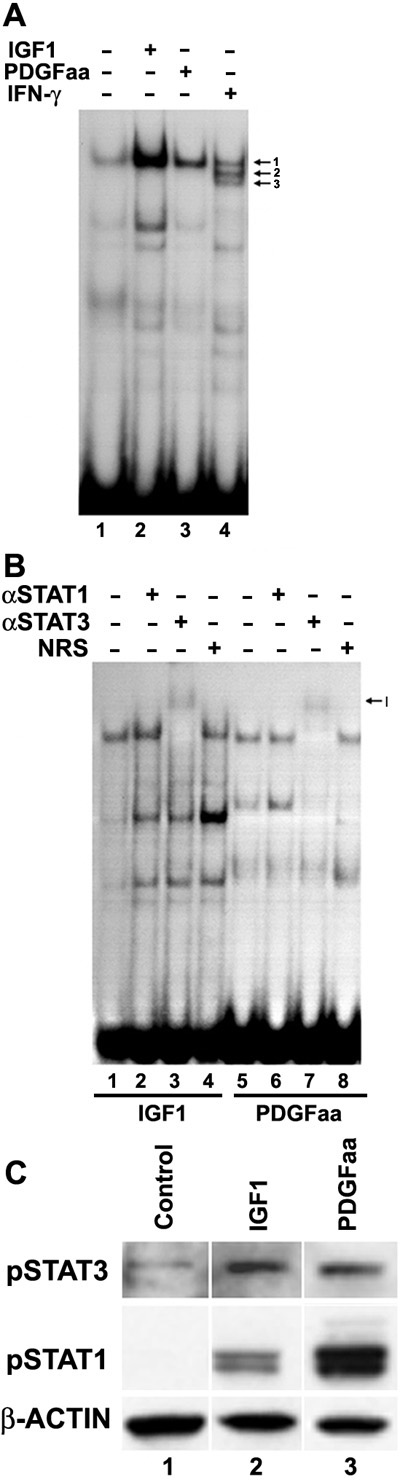
Figure 2. STAT1 and STAT3 are activated in lens cells in response to IGF1, PDGF, and IFN-γ stimulation
A: Electrophoretic Mobility Shift Assay (EMSA) of nuclear extracts (10 μg) from 1AMLE6 lens cells stimulated with IGF1, PDGFaa or IFN-γ using the m67 SIE GAS probe as described in Materials and Methods. Arrows to the right of figure indicate STAT3 homo-dimers (1), STAT1-STAT3 hetero-dimers (2), and STAT1 homo-dimers (3). B: Supershift analysis of nuclear extracts from 1AMLE6 cells stimulated in serum free medium (lanes 1 and 5), IGF1 (lanes 2-4), or PDGFaa (lanes 6-8). Supershifted bands are indicated as I. NRS indicates normal rabbit serum. C: Western blot analysis of whole cell extracts (40 μg/lane) from 1AMLE6 cells stimulated in serum free medium (lane 1), IGF1 (lane 2) or PDGFaa (lane 3) using antibodies specific for the tyrosine phosphorylated STAT1 (pSTAT1) or pSTAT3. Detection of pSTAT3 signals was by standard ECL chemiluminescence while pSTAT1 was detected using the more sensitive SuperSignal Pico Chemiluminescent substrate. Blots were stripped and reprobed with antibodies to β-actin.