Figure 4 of Le, Mol Vis 2004; 10:1011-1018.
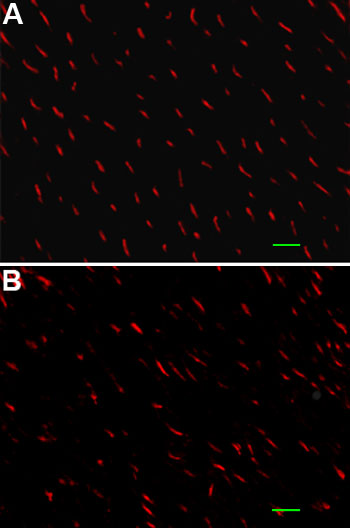
Figure 4. Cone distribution in HRGP-cre mice
Lectin staining showing cone photoreceptor distribution in 6 month old transgenic (A) and wild type littermate (B). The scale bars represent 16 μm.