![]() Figure 3 of
Le, Mol Vis 2004;
10:1011-1018.
Figure 3 of
Le, Mol Vis 2004;
10:1011-1018.
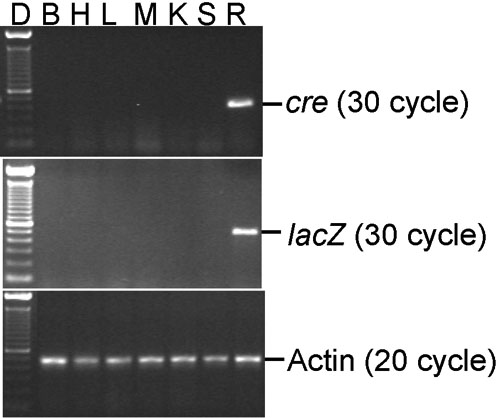
Figure 3. Analysis of Cre expression in representative tissues
Semi-quantitative RT-PCR analysis of Cre expression in brain (B), heart (H), liver (L), muscle (M), kidney (K), spleen (S), and the retina control (R). The lane labeled "D" has a 100 bp DNA size marker. The expected RT-PCR products for cre (411 bp), Cre activated reporter gene LacZ (495 bp), and Actin (450 bp) were identified on the gel. No apparent ecotopic Cre expression was identified.