![]() Figure 2 of
Le, Mol Vis 2004;
10:1011-1018.
Figure 2 of
Le, Mol Vis 2004;
10:1011-1018.
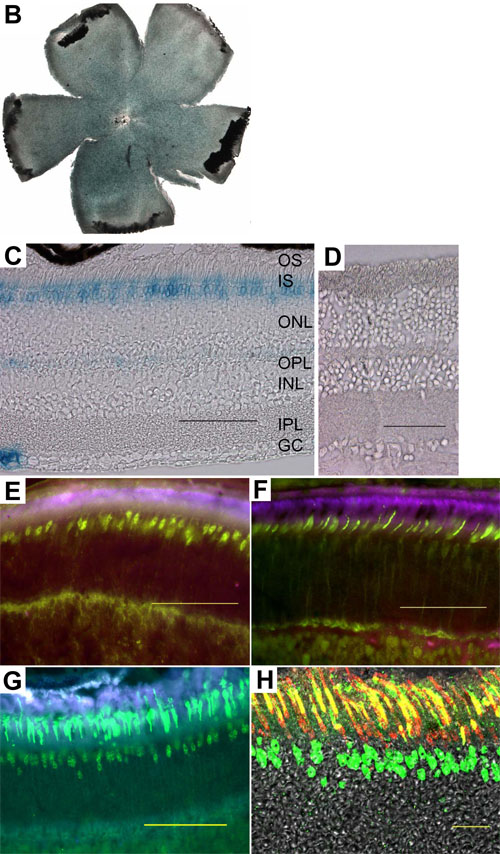
Figure 2. Localization and functional analysis of Cre expression
A: Strategy of functional assay using F1 mice derived from HRGP-cre transgenic mice and Cre activatable LacZ reporter (R26R) mice. B: β-Galactosidase staining of retinal flat mount. C: β-Galactosidase staining of section from double transgenic F1 of HRGP-cre/R26R mice. D: β-Galactosidase staining of retinal section from negative control mice. E: Fluorescent microscopy of retinal section stained with anti-Cre polycolonal antibody (green in cone nuclei). Purple represents autoflorescence. F: Fluorescent microscopy of retinal section stained with anti-M-opsin antibody (green in cone outer segments). Purple represents autoflorescence. G: Fluorescent microscopy of retinal section stained for Cre (green in cone nuclei) and M-Opsin (green in cone outer segments). H: Confocal microscopy of retinal section stained for Cre (green in cone nuclei), M-opsin (green in cone outer segments) and peanut agglutinin (PNA, red in cone outer segments). PNA stains with both M- and S-cone cells. Yellow represents overlapping of M-opsin and PNA staining. The scale bar represents 100 μm in B-G and 20 μm in H. The retinal outer segment (OS), retinal inner segment (IS), outer nuclear layer (ONL), outer plexiform layer (OPL), inner nuclear layer (INL), inner plexiform layer (IPL), ganglion cell layer (GC), cone outer segment (COS), cone nuclei (CN), are also labeled. Almost all cones express Cre recombinase.