![]() Figure 2 of
Sundaresan, Mol Vis 2004;
10:1005-1010.
Figure 2 of
Sundaresan, Mol Vis 2004;
10:1005-1010.
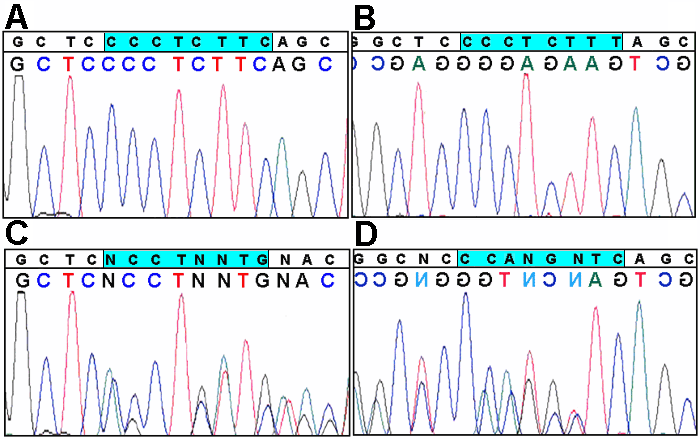
Figure 2. Chromatogram comparison between normal and mutant TYR gene
Chromatogram showing the sequence variations in the TYR gene in exon 2 are highlighted. Panels show the forward (A) and reverse (B) sequence derived from a normal individual and forward (C) and reverse (D) sequence derived from an OCA1 patient. An eight base pair deletion (c.937del8) in this OCA1 patient is highlighted.