![]() Figure 4 of
Hughes, Mol Vis 2004;
10:996-1004.
Figure 4 of
Hughes, Mol Vis 2004;
10:996-1004.
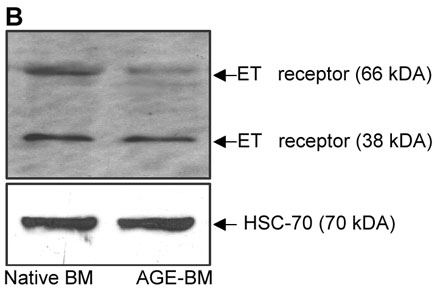
Figure 4. ETA receptor mRNA and protein expression in RMPs cultured on native and AGE-BM
A: RT-PCR indicated that there was a no change in ETA receptor mRNA expression following exposure of RMPs to AGE-BM. Data were normalized to rRNA and acidic ribosomal phosphoprotein, whose expression was unchanged on AGE-BM (p<0.05). Each column represents the mean of 3 independent experiments. Variability in absolute levels of gene expression (arbitary values) among replicates was eliminated by dividing the ETA receptor expression for the individual treatments by the sum total of gene expression under both conditions and this value then expressed as a percentage. B: Western blot showing the expression of two ETA receptor species following exposure of RMPs to AGE-BM. The western blot was re-probed with an antibody to HSC-70 to confirm equal protein loading. C,D: Densitometric analysis revealed that there was a reduction in the 66 kDa ETA receptor species and no change in the 38 kDa ETA receptor proteolytic fragment with AGE modified BM. Each column represents the mean of 6 individual experiments. Asterisk (*) indicates p<0.05.