![]() Figure 3 of
Hughes, Mol Vis 2004;
10:996-1004.
Figure 3 of
Hughes, Mol Vis 2004;
10:996-1004.
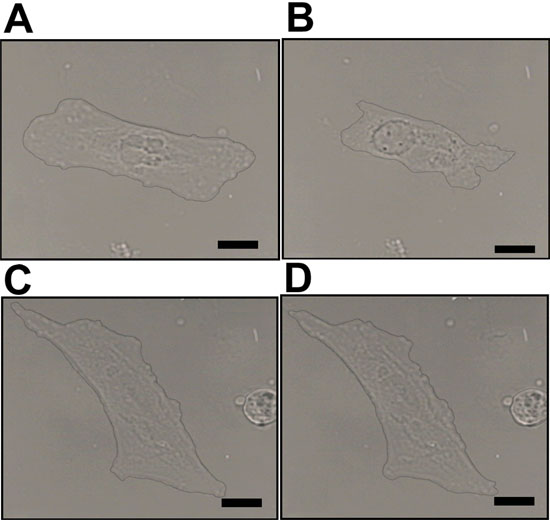
Figure 3. Et-1 induced contraction in RMPs cultured on native and AGE-BM
A,B: Light micrograph showing a pre-relaxed (10 μM forskolin for 10 min) pericyte grown on native BM for 12 h, before (A) and 10 min after 10 nM Et-1 (B). Scale bars represent 20 μm. C,D: Light micrograph showing a pre-relaxed pericyte cultured on AGE-BM, before (C) and 10 min after stimulation with Et-1 (D). Scale bars represent 20 μm. E: Quantification using image analysis confirmed that RMPs cultured on AGE-BM exhibited a reduced ability to contract (for native BM, n=7; for AGE-BM, n=6). Double asterisk (**) indicates p<0.01.