![]() Figure 2 of
Hughes, Mol Vis 2004;
10:996-1004.
Figure 2 of
Hughes, Mol Vis 2004;
10:996-1004.
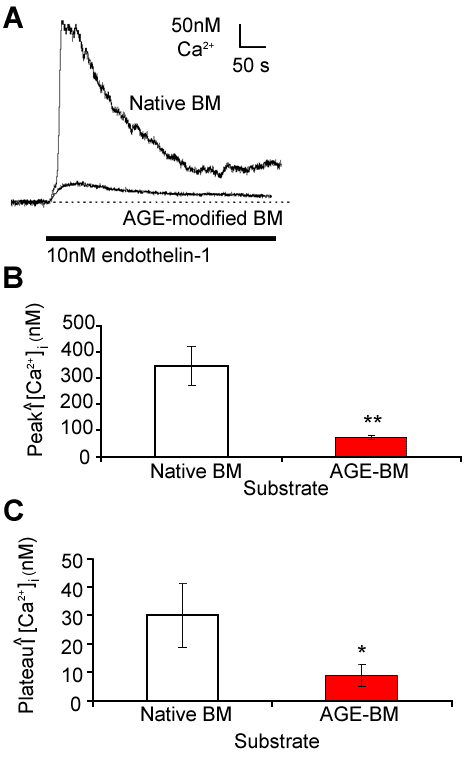
Figure 2. Et-1 induced calcium transients in RMPs cultured on native and AGE-BM
A: Representative traces showing that both peak and plateau increases in [Ca2+]i with Et-1 are severely impaired in RMPs cultured on AGE-BM. B: Mean data demonstrating that peak increases in [Ca2+]i with Et-1 are depressed for native BM (n=11) compared to AGE-BM (n=15). Double asterisk (**) indicates p<0.01. C: Mean data demonstrating that plateau increases in [Ca2+]i with Et-1 are depressed for native BM (n=11) compared to AGE-BM (n=15). Asterisk (*) indicates p<0.05.