![]() Figure 2 of
Yang, Mol Vis 2004;
10:987-995.
Figure 2 of
Yang, Mol Vis 2004;
10:987-995.
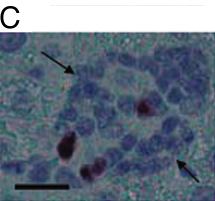
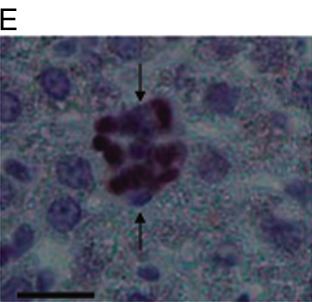
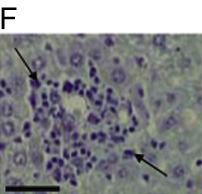
Figure 2. Low dose angiostatin treatment causes increase in apoptosis:proliferation ratio in melanoma micrometastasis
A: TUNEL analysis shows significantly more apoptosis in hepatic micrometastasis in low dose angiostatin (0.1 μg/μl) treated mice compared to PBS treated controls. B: MIB1 (anti-Ki67) analysis shows significantly more proliferation in hepatic micrometastasis in PBS treated control compared to low dose angiostatin (0.1 μg/μl) treated mice. Taken together, A and B show increased apoptosis:proliferation ratio after low dose angiostatin treatment. C: Micrometastatic hepatic melanoma (between arrows) in PBS treated control immunostained for TUNEL (100x). D: Micrometastatic hepatic melanoma (between arrows) after low dose angiostatin treatment immunostained for TUNEL (100x). E: Immunostain for MIB1 (anti-Ki67) shows proliferation in hepatic micrometastatic melanoma (between arrows) in PBS treated control (100x). F: Immunostain for MIB1 shows lack of proliferation in hepatic micrometastatic melanoma (between arrows) after low dose angiostatin treatment (100x). Brown indicates positive reaction product. Bar represents 50 μm. Panels C-F show the B16LS9 cell line.