![]() Figure 1 of
Yang, Mol Vis 2004;
10:987-995.
Figure 1 of
Yang, Mol Vis 2004;
10:987-995.
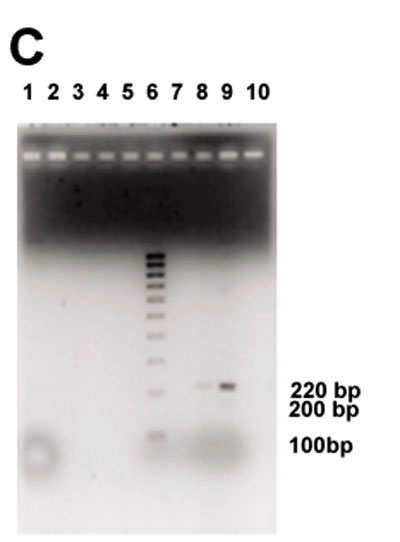
Figure 1. B16F10 and B16LS9 melanoma cells produce plasminogen and cleave plasminogen into angiostatin
A: The angiostatin bioassay compared to the control shows Queens 0%, B16F10 57%, and B16LS9 127%. B: Western analysis shows angiostatin protein (50 kDa) produced by B16F10 and B16LS9 cell lines. C: RT-PCR shows mRNA for plasminogen (220 bp) produced by B16F10 and B16LS9 cell lines (lanes 8 and 9, respectively). There is no plasminogen mRNA expressed from Queens cells (lane 7). A 100 bp molecular ruler is present in lane 6.