![]() Figure 2 of
Fischer, Mol Vis 2004;
10:973-986.
Figure 2 of
Fischer, Mol Vis 2004;
10:973-986.
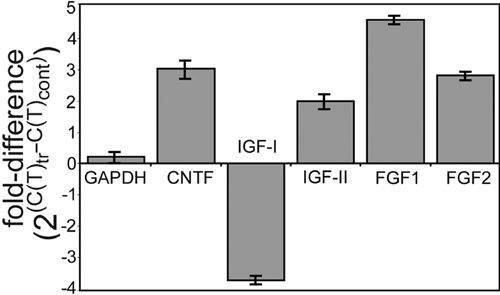
Figure 2. Expression levels of growth factors are affected by retinal damage
At 3 days after NMDA treatment, retinal expression levels of CNTF, IGF-II, FGF1, and FGF2 were increased, whereas the level of IGF-I was decreased. The histogram illustrates the fold difference of the growth factors as measured by quantitative PCR. Fold difference was calculated as 2x where x equals the C(T)NMDA treated minus C(T)control. The CT value is the PCR cycle number at which the reaction enters log phase and is inversely proportional to transcript abundance. CT values were averages of samples run in triplicate.
