![]() Figure 7 of
Tanemura, Mol Vis 2004;
10:923-932.
Figure 7 of
Tanemura, Mol Vis 2004;
10:923-932.
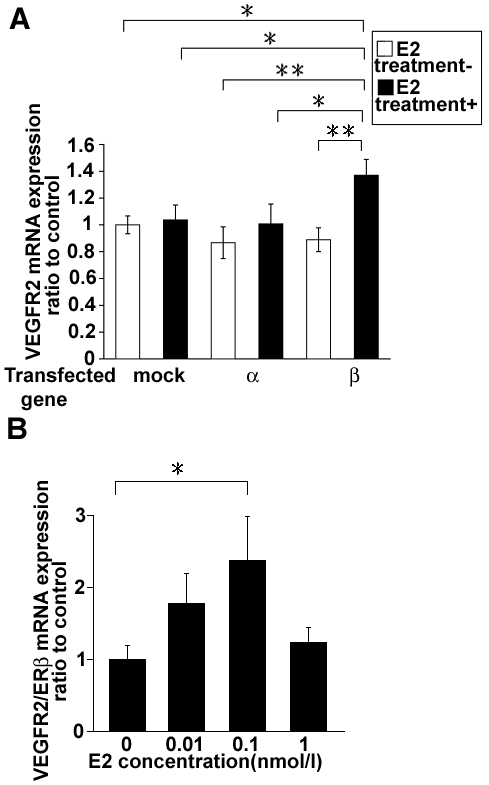
Figure 7. The effect of ERs and E2 on VEGFR2 gene expression in HUVECs
ERα, ERβ, or mock were each transfected to HUVECs. Then after 24 h of E2 treatment RNA was extracted and VEGFR2 gene expression levels were evaluated using real time PCR. Results represent three independent experiments performed in triplicated samples. The bars represent mean results; the error bars represent the standard error of the mean. A: VEGFR2 gene expression with or without 0.1 nM E2 treatment are shown as a ratio to the control (mock transfected without E2 treatment, n=8). Asterisk and double asterisk mark significant (p<0.05 and p<0.01, respectively) differences. B: VEGFR2 gene expressions in ERβ transfected HUVECs (normalized by ERβ expression levels) with different dose of E2 treatment. Results are shown as a ratio to control (ERβ-transfected without E2 treatment, n=10). Asterisk marks significant (p<0.05) differences.
