![]() Figure 3 of
Tanemura, Mol Vis 2004;
10:923-932.
Figure 3 of
Tanemura, Mol Vis 2004;
10:923-932.
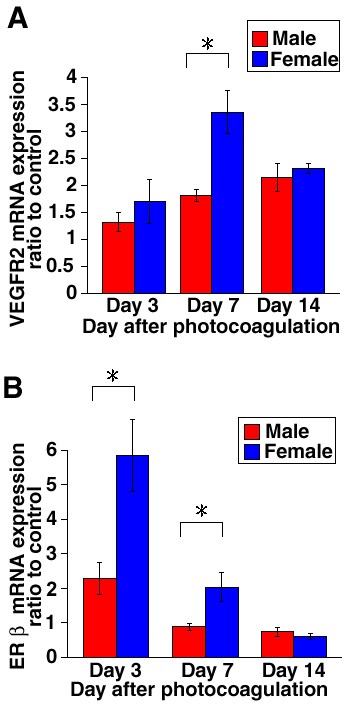
Figure 3. mRNA expression of VEGFR2 and ERβ in male and female rat retinae 3, 7, and 14 days after photocoagulation
mRNA expression was analyzed by real time PCR. Results represent three independent experiments performed in duplicated samples. Levels of gene expression are shown as a ratio to untreated controls of the same gender and shown as mean (6 to 8 eyes); the error bars represent the standard error of the mean. A: The fold increase of VEGFR2 mRNA expression on day 3, 7, and 14 after photocoagulation. Asterisk marks significant (p<0.01) differences. B: The fold increase of ERβ mRNA expression on day 3, 7, and 14 after photocoagulation. Asterisks mark significant (p<0.05) differences.
