![]() Figure 1 of
Kumar, Mol Vis 2004;
10:910-916.
Figure 1 of
Kumar, Mol Vis 2004;
10:910-916.
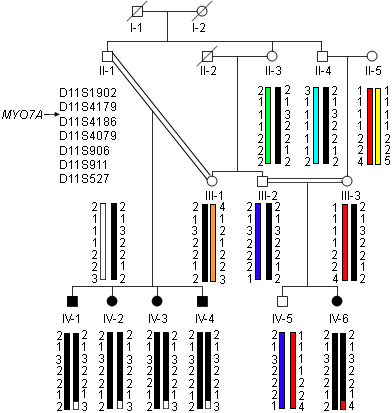
Figure 1. Haplotype analysis of the family with markers from the USH1B locus
Different haplotypes are shown by bars with different patterns. Black bar represents the disease haplotype. The position of the MYO7A gene is shown.
