![]() Figure 1 of
Feng, Mol Vis 2004;
10:845-850.
Figure 1 of
Feng, Mol Vis 2004;
10:845-850.
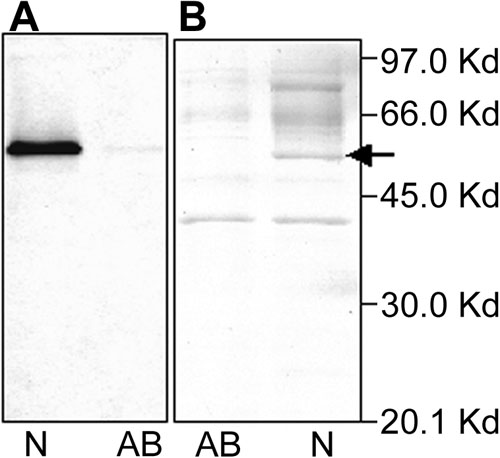
Figure 1. ALDH3A1 levels decrease after cornea alkali burn
A: ALDH3A1 specific substrate zymography of 10 μg water soluble protein from control mouse cornea (N) and at day 1 after alkali burn (AB). The size and position of markers are shown on the right. Protein samples were separated by 10% non-denaturing SDS-PAGE. After rinsing out SDS from the gel the ALDH3A1 band was developed for 15 min at 37 °C with 10 ml of 10 mM phosphate buffer (pH 7.0) containing 20 mg NADP+, 8 mg MTT, 0.4 mg phenazine methosulfate and 20 μl benzaldehyde. B: SDS-PAGE (10% polyacrylamide) of 10 μg water soluble protein from normal (N) and Day 1 (AB) after alkali burned mouse cornea. the arrow indicates the ALDH3A1 band in the normal sample, which disappears in the sample from alkali burned cornea.