![]() Figure 7 of
Brossas, Mol Vis 2004;
10:65-73.
Figure 7 of
Brossas, Mol Vis 2004;
10:65-73.
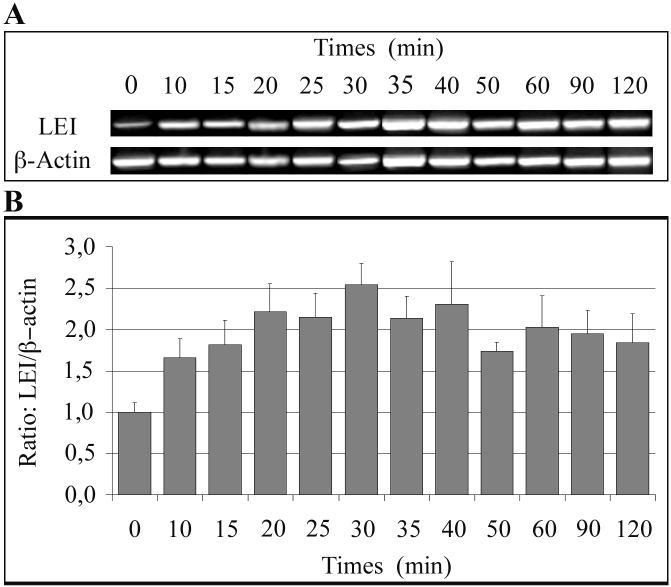
Figure 7. RT-PCR analysis of leukocyte elastase inhibitor gene expression
ARPE-19 cells were exposed to 10% ethanol and analyzed by RT-PCR at different times after ethanol exposure. Panel A: Representative electrophoresis pattern of PCR products. The gel was stained with ethidium bromide. Leukocyte elastase inhibitor (LEI) and β-actin migrated at the predicted sizes of 420 and 243 base pairs respectively (top and bottom). The relative quantities of the ratios of LEI and β-actin PCR products were determined by densitometric analysis, and the ratio of the LEI versus the β-actin products were calculated. Panel B: LEI/β-actin ratio histograms during time. In LEI/β-actin ratio experiments, values are means±standard deviation of three different experiments.